Regression Analysis to Reduce Poverty and Violence in Honduras
Table of Contents

1. Introduction
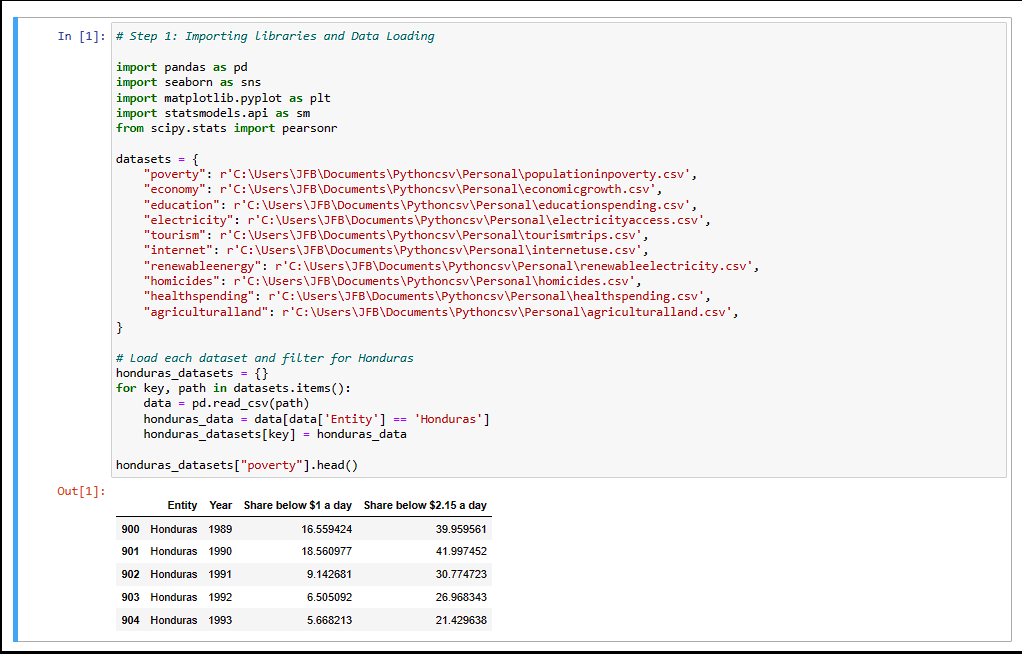
In this project, I downloaded multiple datasets from Our World in Data. These datasets are related to the following topics:
- Poverty - Share Below $1 and $2.15 a day.
- Economy - GDP per capita
- Education - Education Spending
- Electricity - Urban and Rural access to electricity
- Tourism - Tourists
- Internet - Internet Users
- Renewable Energy - Renewable electricity share
- Violence - Homicides
- Health Spending - Health Spending
- Agricultural Land - Agricultural land hectares
2. Procedure
First, I had to import and merge the Data:
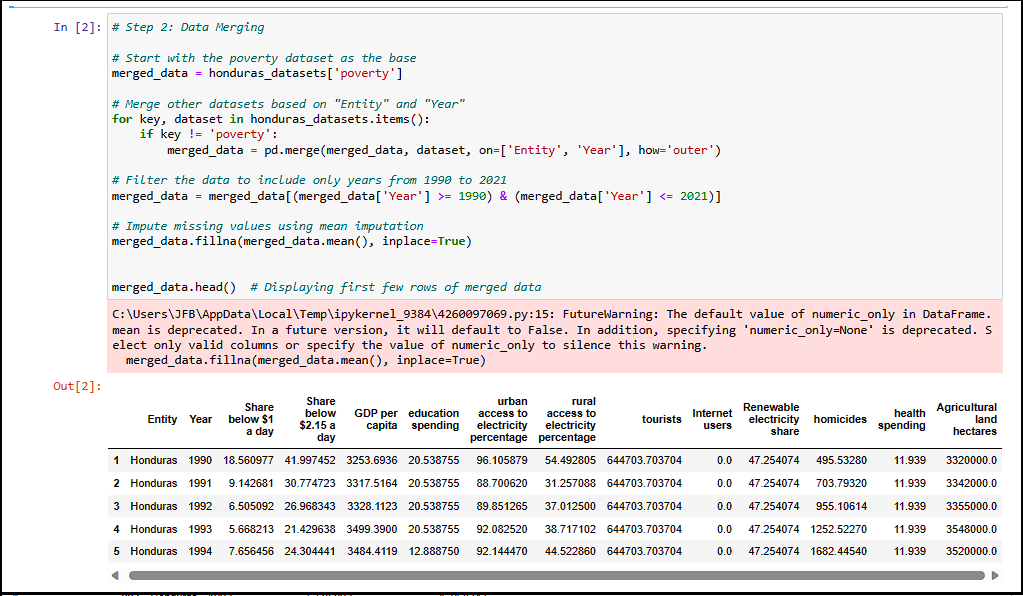
Once I imported all the different datasets I downloaded, I realized I had not cleaned them. First, I joined them on Entity and Year. Then, upon closer inspection, it appeared that by filtering for the years 1990 and 2021 the data would be clean for my purposes.
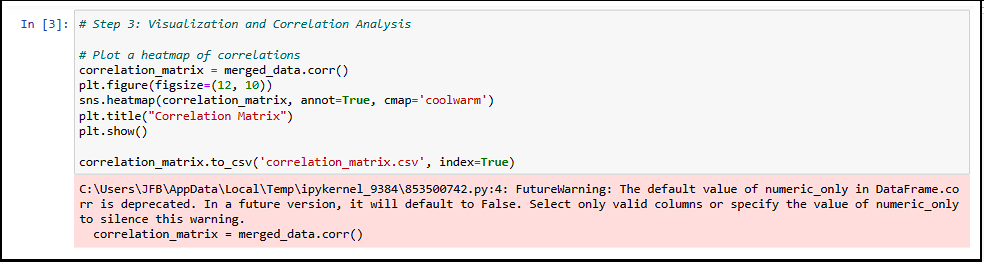
Having my Data ready for processing, I decided to create a heatmap of correlations to easily identify which values were higher and for an overall view of correlations.
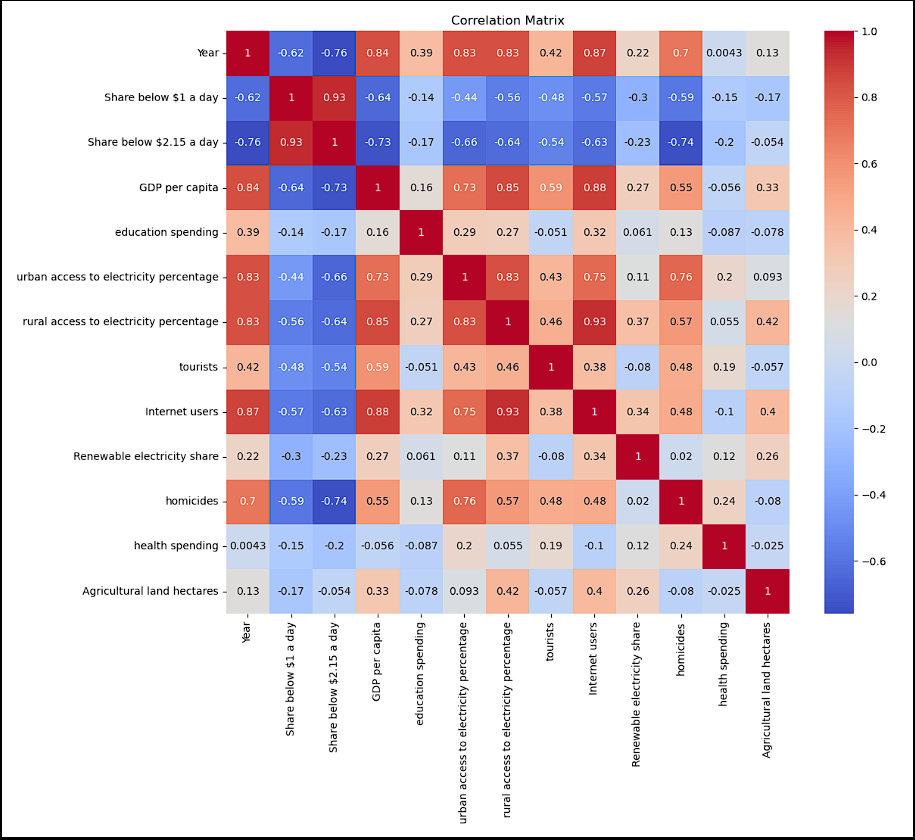
As you can see, the heat map clearly indicates hotter or redder values. I could quickly identify how both rural access to electricity and internet users are correlated.
But just in case, I decided to identify the top 5 correlations which were GDP per capita, Year, homicides, Internet users, and rural access to electricity.
3. Results
With this, we can now go onto the regression analysis. First, we will analyze poverty:
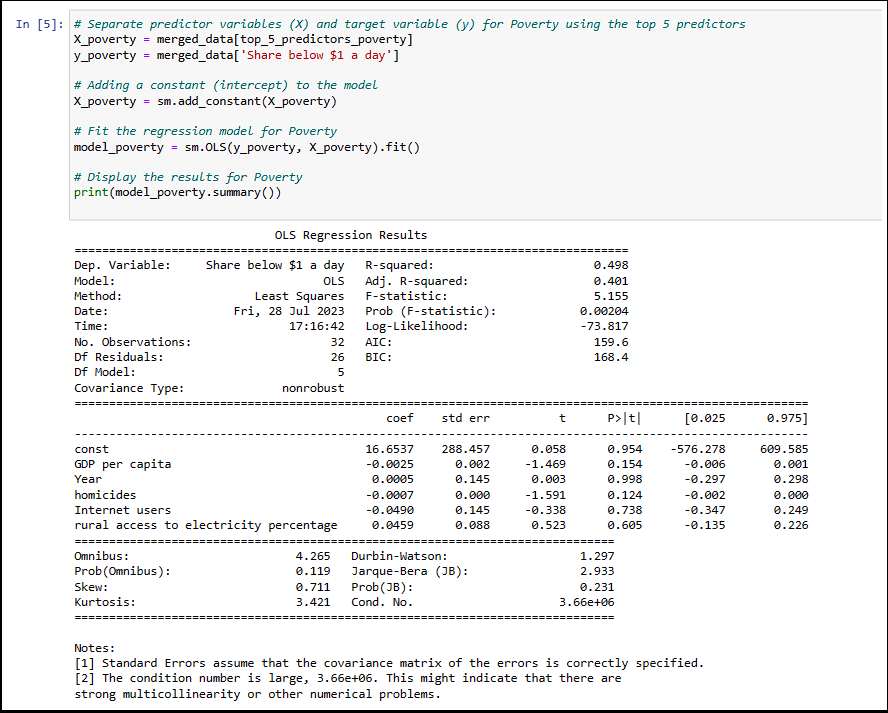
You might now be asking yourself, "Ok, what do these numbers mean?"
A R-squared value of 0.498 and an adjusted value of 0.401 implies that about 49.8% of the variability in the dependent variable is explained by the model. After adjusting the number of predictors, about 40.1% of the variability is explained.
The F-statistic being 5.155 indicates that the model is statistically significant at conventional levels, suggesting that at least one of the predictors is useful in predicting the dependent variable.
However, the individual p-values are higher than 0.05 for each column. This means that the individual values are not statistically significant, but it is worth noting that the model as a whole does have some explanatory power over the poverty rate.
We will now run the regression analysis on homicides in order to search for strategies to reduce violence. I obtained better results with this second analysis.
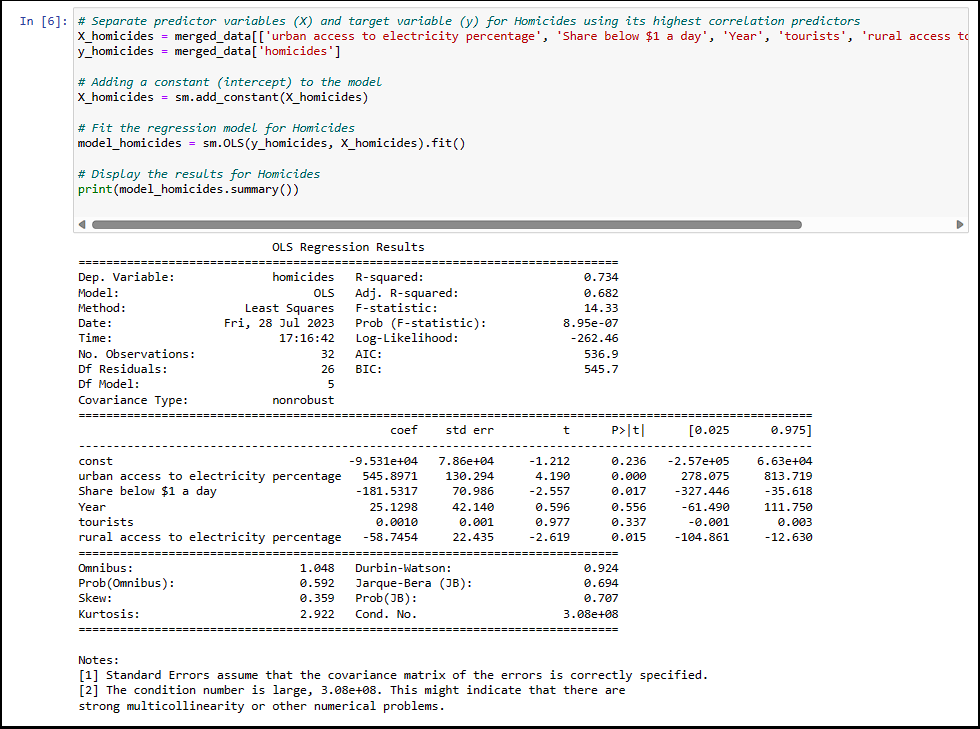
In this case, the value is 0.734 for R-squared which means that 73.4% of the variability in the homicide rate can be explained by the independent values in the model. This is a high value, suggesting that the model has significant explanatory power. When using the Adjusted R-squared, the value is 0.682 which is slightly lower but still a very good fit.
The F-statistic is 14.33 this time around, almost three times higher than that for the poverty model, suggesting that the predictors in the homicide model collectively explain more of the variation in the dependent variable. Both models are statistically significant at conventional levels, but the homicide model appears to have stronger overall explanatory power.
The values obtained for both urban and rural access to electricity and share below $1 a day are both statistically significant.
4. Conclusions
Poverty Model
The poverty model offers valuable insights into the economic landscape of Honduras, but it also raises questions about the underlying drivers of poverty. Individual predictors such as "GDP per capita," "homicides," "Internet users," and "rural access to electricity percentage" were not statistically significant, suggesting that they may not be the primary factors influencing poverty in the current model. However, the strong negative correlations observed between "Share Below $1 a day" and variables like "GDP Per Capita" (-0.64), "Rural Access to Electricity" (-0.56), and "Internet Users" (-0.57) provide clues about the interaction between economic and social factors.
The negative correlation between poverty and years (-0.62) is an encouraging sign of progress but represents the need for more robust efforts to reduce poverty to build a stronger negative correlation. Further refinement of the model, including consideration of other variables, interactions between predictors, or alternative specifications, could lead to a more nuanced understanding of poverty dynamics in Honduras.
Violence Model
The analysis of homicides in Honduras presents an intriguing picture of the factors influencing violence. The only negative correlation for homicides are both poverty indicators, with "Share below $2.15 a day" having the strongest at -0.74, although this relationship requires more in-depth examination, as with the values obtained, this means that a 1% increase in "Share below $2.15 a day" is related to approximately 106 fewer homicides. Significant predictors such as "urban access to electricity percentage" have high correlation with homicides (0.76).
The regression analysis demonstrated that the values obtained for access to electricity and share below $1, $2.15 a day are statistically significant. Due to the results obtained, policy interventions focused on equitable urban development and poverty alleviation could be key to addressing the challenge of violence, but a comprehensive approach that considers multiple dimensions of society is essential.